The following article was originally published by The Perth Mint and is reproduced with permission. The original can be found here.
Gold tends to get all the glory when people look for an investment with a low correlation to traditional assets such as stocks and bonds.
But many invest in silver as an inflation hedge and to help protect the overall value of their portfolio in times of economic turmoil.
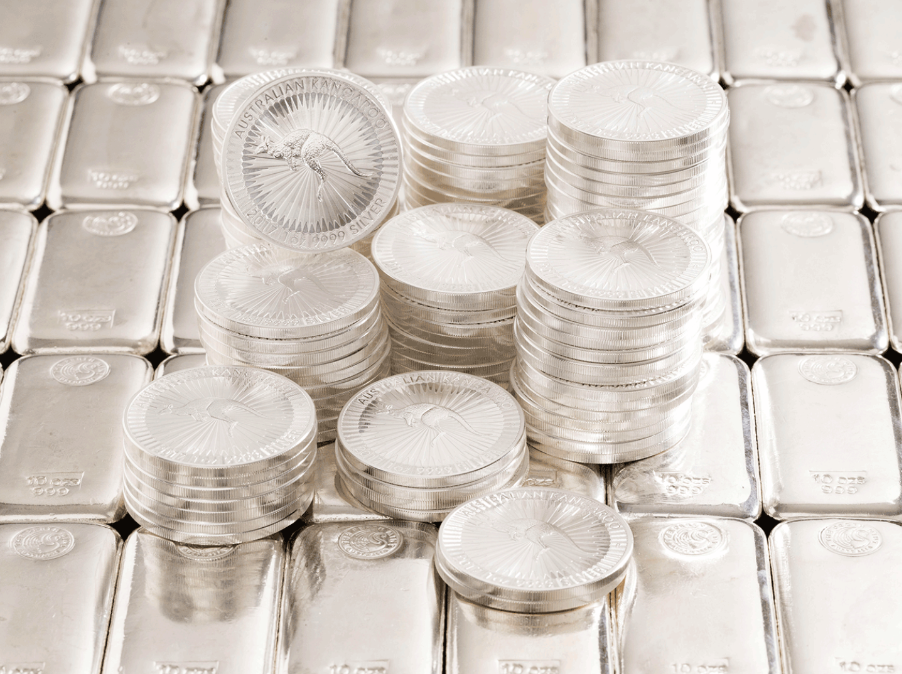
One tried and trusted method of silver investing is known as ‘stacking’. Simply put, a silver stacker accumulates physical pieces of silver bullion over time, quite often until it meets a predetermined percentage of their overall assets.
Silver offers stackers many of the benefits of gold, with some important extra advantages.
Both precious metals represent ‘hard’ assets they physically own, thus insulating them from the counterparty risk associated with paper investments.
Both are relatively rare, and because they cannot be created by governments are considered to be the ultimate forms of money – meaning they will outlast fiat currencies which may eventually fall victim to inflation.
Silver has the advantage that it is cheaper per ounce, allowing stackers to build significant holdings by making regular additions to their stockpile over time.
Demand for silver is not only driven by investors – it also benefits from diverse and growing uses in industry, technology, science and medicine.
And silver can also be fun to collect – the multiplicity of coins and bars available giving it a hobby-like appeal.
Inflation hedge
Silver stackers are acutely aware that over time, currency may lose its purchasing power due to inflation. The Zimbabwean dollar and Venezuelan bolívar are two recent examples of currencies to have been shattered by rapid inflation.
Even the world’s most heavily traded currency – the US dollar – is vulnerable. Between 1971 and 2021, the rate of inflation in the United States amounted to 569.2% at an average annual rate of 3.88%. This meant that USD 1.00 in 1971 was the equivalent to USD 6.69 in 2021.1
The cost of one ounce of silver in 1971 was USD 1.54. Fifty years later, an ounce cost USD 25.14, a 1,532% increase.2
Using these numbers over this timeframe, it can be seen that silver was extremely effective at helping to preserve wealth.
Of course, the price of silver did not rise in a straight line during this period. In fact, silver had some dizzying surges and some disheartening slumps.
Silver volatility
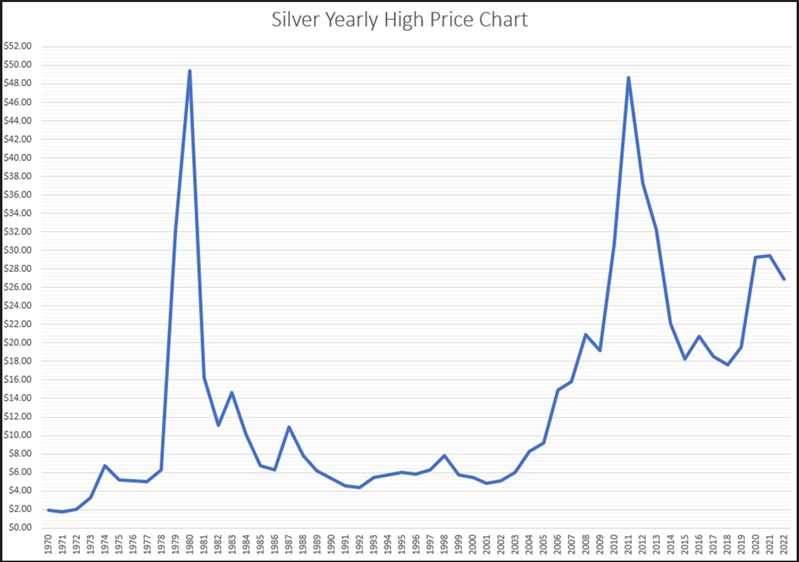
Graph showing year highs for the silver price in US dollars 1970 to 2022.
In the 1970s, billionaires Nelson Bunker Hunt, William Herbert Hunt, and Lamar Hunt worried about the effect of US inflation on their wealth, a huge sum they’d inherited from their oil tycoon father.
The Hunt brother’s response was their infamous attempt to ‘corner the market’ in silver. Relying heavily on margin loans to fund their purchases, it’s estimated they gained control of about one-third of the entire global supply of privately-owned silver.
Prices began skyrocketing in 1979 and by January 1980 were rapidly heading towards USD 50.00 per ounce. But the Hunt brothers’ strategy suddenly unraveled, in part due to new restrictions on margin traders, and the price crashed, dropping over 50% in just four days.3
Silver spiked again in 2011 during the recessionary aftermath of the global financial crisis, and to a lesser extent in response to the economic downturn caused by 2020’s ‘great lockdown’.
Theoretically, a recession should be bad news for silver as reduced economic activity means less demand from industry. But on both occasions, panicky buyers suddenly bought up silver to compensate for losses elsewhere, pushing the price significantly higher for a while.
Silver stackers and other long-term investors tend to be less concerned about such rapid peaks and troughs. They’re comfortable in the belief that even though the overall value of their silver will go up and down, ultimately it’s a form of insurance against investment risk that also helps them stay ahead of the inflation curve.
How much silver is enough?
As stated earlier, growing a stockpile of silver over time is a stacker’s major objective. A new report has not only validated the practice further, but also provided guidance on the optimum allocation to the precious metal within a balanced portfolio.
Undertaken by independent economic advisory firm Oxford Economics on behalf of The Silver Institute, the report’s findings are especially interesting, given the fact that silver is often overlooked in favour of gold when making decisions about alternative assets.
Oxford Economics said that in order to examine the potential long-run benefits of holding silver in a portfolio, it compared its historic performance with a range of traditional asset classes, including stocks, bonds, commodities and gold for the period January 1999 to June 2022.
Its analysis confirmed that silver has a relatively low historical correlation to asset classes other than gold, and, as a result of ‘more rigorous tests’, found its return characteristics to be sufficiently different to gold to make it a valuable diversification tool that deserves its own portfolio commitment.
Interestingly, the authors found the average optimal allocation to silver was in the range of four to five percent for a portfolio with a five-year holding period.
For anyone interested in discovering more about the methodologies used, The Relevance of Silver in a Global Multi-Asset Portfolio is available to download from The Silver Institute and Oxford Economics.
Experts express optimism
In further news of interest to silver stackers, delegates surveyed at the London Bullion Market Association’s Global Precious Metals Conference in October said that while they expected gold prices to rise over the next 12 months, silver had the most potential.
They forecast that silver prices would rise to USD 28.30, up more than 50% on current levels.
Investing in silver, it appears, stacks up in the opinion of many.
1 Inflation timeline in the United States (1971 – 2021), InflationTool, inflationtool.com/us-dollar?amount=1&year1=1971&year2=2021&frequency=yearly
2 Silver Prices -100 Year Historical Chart, Macrotrends, macrotrends.net/1470/historical-silver-prices-100-year-chart
3 Silver Thursday, Wikipedia, en.wikipedia.org/wiki/Silver_Thursday
DISCLAIMER
Past performance does not guarantee future results. The information in this article and the links provided are for general information only and should not be taken as constituting professional advice from The Perth Mint. The Perth Mint is not a financial adviser. You should consider seeking independent financial advice to check how the information in this article relates to your unique circumstances. All data, including prices, quotes, valuations and statistics included have been obtained from sources The Perth Mint deems to be reliable, but we do not guarantee their accuracy or completeness. The Perth Mint is not liable for any loss caused, whether due to negligence or otherwise, arising from the use of, or reliance on, the information provided directly or indirectly, by use of this article.